
Getty
Do you file an accurate tax return and pay what you owe each year? If so, you’re in the majority: a report released by the Internal Revenue Service (IRS) indicates that the nation’s tax compliance rate is holding at 84%, the same as in prior years.
The report also provides an estimate of the tax gap for the tax years 2011 through 2013. The last report issued by the IRS had covered the tax years 2008 through 2010.
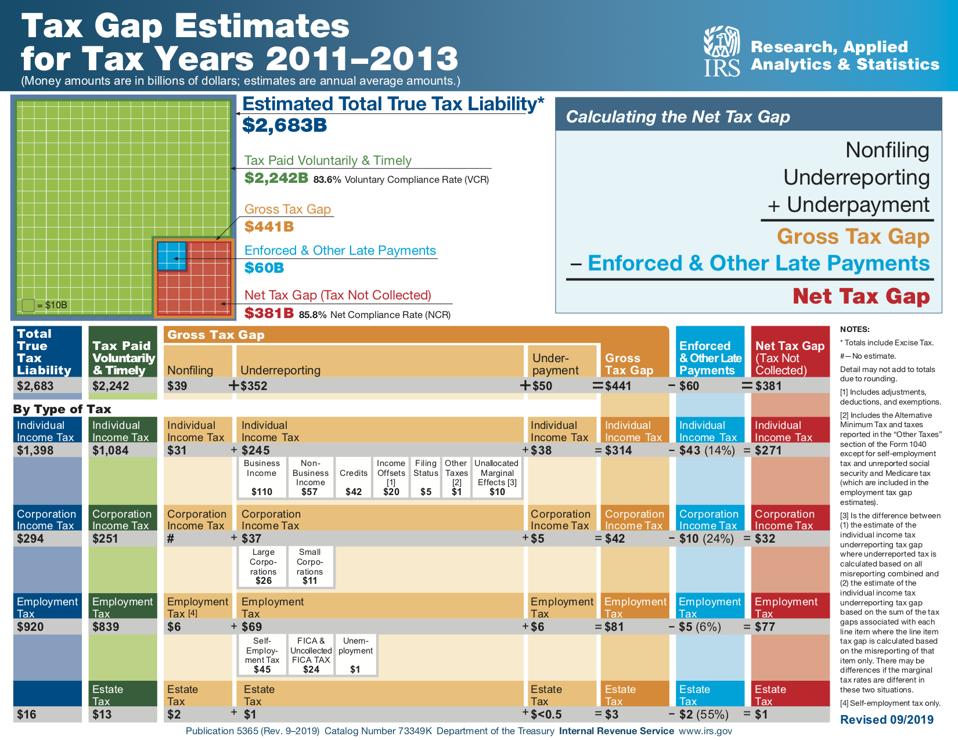
The tax gap refers to the difference between the amount of taxes owed to the government as compared to what the government actually collects. The tax gap can be further broken down into two pieces: the gross tax gap and the net tax gap. The gross tax gap is the amount of true tax liability that is not paid voluntarily and timely. The net tax gap is the amount between the gross tax gap and tax that will eventually be paid late or as a result of IRS enforcement activities.
The average gross tax gap for the tax years 2011 through 2013 is estimated to be $441 billion. That breaks down into three pieces: non-filing ($39 billion), underreporting ($352 billion), and underpayment ($50 billion). By taxpayer type, the estimated gross tax gap works out as follows:
- Individual income tax: $314 billion
- Corporation income tax: $42 billion
- Employment tax: $81 billion
- Estate and excise tax: $3 billion
Of those unpaid taxes, the IRS estimates that they’ll eventually collect $60 billion, resulting in a net tax gap of $381 billion. By taxpayer type, the estimated net tax gap works out as follows:
- Individual income tax: $271 billion
- Corporation income tax: $32 billion
- Employment tax: $77 billion
- Estate and excise tax: $1 billion
The portion of taxes that are paid voluntarily and on time is called the voluntary compliance rate. The most recent voluntary compliance rate is 83.6%, practically the same as the prior rate of 83.8%. How does that translate into dollars? A one-percentage-point increase in voluntary compliance would bring in about $30 billion in additional tax receipts.
“Voluntary compliance is the bedrock of our tax system, and it’s important it is holding steady,” said IRS Commissioner Chuck Rettig. “Tax gap estimates help policy makers and the IRS in identifying where noncompliance is most prevalent. The results also underscore that both solid taxpayer service and effective enforcement are needed for the best possible tax administration.”
IRS
(For a full size version which downloads as a PDF, click here.)
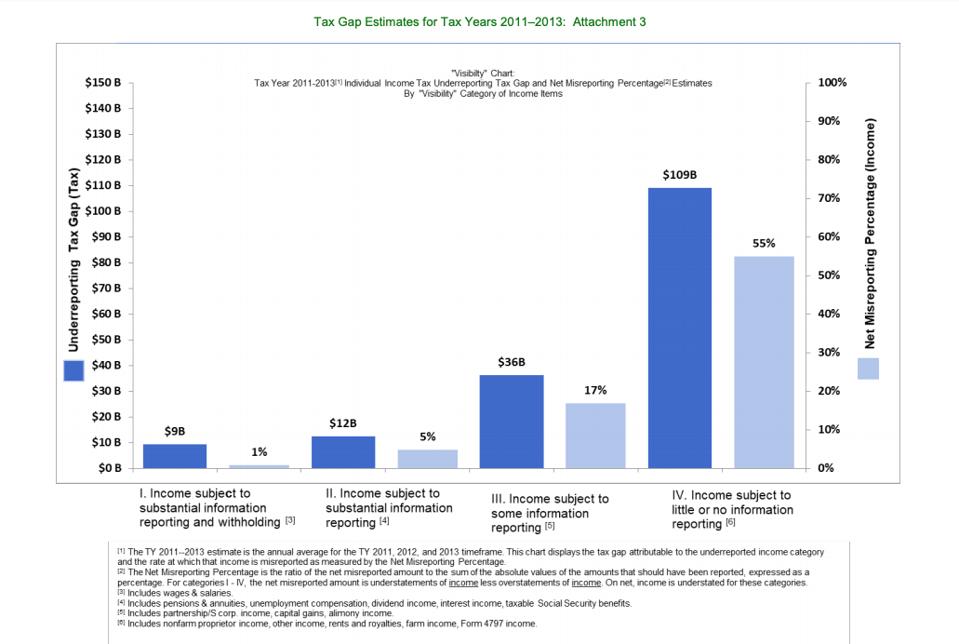
Compliance is higher when amounts are subject to information reporting – like forms W-2 and 1099 – and even higher when also subject to withholding. For example, misreporting of income amounts subject to substantial information reporting and withholding is 1%, while income amounts subject to little or no information reporting, such as sole proprietor (nonfarm) income, is 55%.
IRS
“Maintaining the highest possible voluntary compliance rate also helps ensure that taxpayers believe our system is fair,” Rettig said. “The vast majority of taxpayers strive to pay what they owe on time. Those who do not pay their fair share ultimately shift the tax burden to those people who properly meet their tax obligations. The IRS will continue to direct our resources to help educate taxpayers about the tax requirements under the law while also focusing on pursuing those who skirt their responsibilities.”
When you factor in enforcement and collection efforts, the estimated share of taxes collected eventually rises to 85.8%.
According to the report, many factors contribute to differences over time in both the gross tax gap and the compliance rates. These include the overall level of economic activity, changes in tax law and administration, updated data and improved methodologies, and changes in compliance behavior on the part of taxpayers and preparers. In the most recent set of data, some of the variance in the gross tax gap estimates not attributable to a shift in methods is due to the growth of the economy following the recession (December 2007 – June 2009). The next set of data should reflect 2014 through 2016, which means that we won’t know the effect – if any – of the Tax Cuts and Jobs Act (TCJA) for quite some time.