This article is part of a series. Click here to read the previous articles.
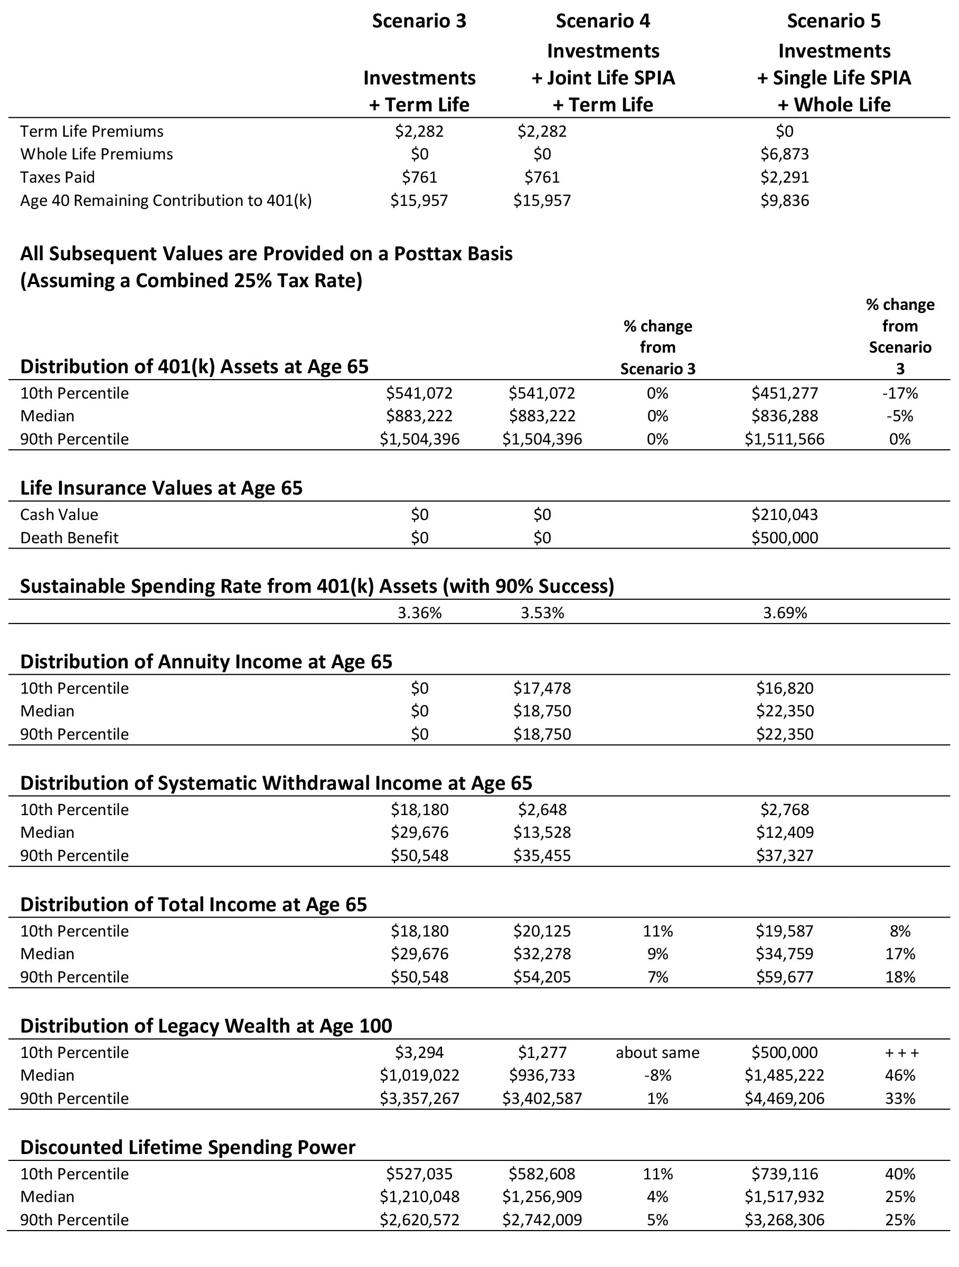
Scenario 4 also uses term life insurance, but the difference is that partial annuitization takes place with a joint life income annuity at the retirement date. The use of an annuity allows for a slight increase in the distribution rate from investments on account of the higher stock allocation for the investment component in retirement. A joint life income annuity with a 3.75 percent payout rate is purchased with assets of up to $666,667 as described. Before taxes, this supports annuity income of up to $25,000, which reflects $18,750 on an after-tax basis. This is the annuity amount at the median and 90th percentile, but there were insufficient assets at the 10th percentile to annuitize this much and preserve $100,000 for liquidity. This explains the smaller $17,478 amount at the 10th percentile.
Annuity income grows with the same 2 percent cost-of-living adjustment to match the assumed overall inflation rate. A 3.53 percent withdrawal rate is then applied to any remaining investment assets to generate additional retirement income for Jerry and Beth. Scenario 4 supports total income at retirement ranging from $20,125 to $54,205 at the tenth and 90th percentiles, with a median income of $32,278. These numbers are larger than in Scenario 3 (11 percent larger at the 10th percentile, 9 percent larger at the median, and 7 percent larger at the 90th percentile). This demonstrates the potential for mortality credits through the income annuity to pool risk to support more spending relative to an investments-only strategy designed to work with a high probability of success.
Exhibit 7.6 Whole Life Insurance Combined with Investments and Income Annuities
Exhibit 7.6 Whole Life Insurance Combined with Investments and Income Annuities
Retirement Researcher
With legacy, Scenario 4 generally provides less, at least before accounting for the fact that it provided higher spending. Because partial annuitization with a life-only income annuity removes a significant chunk of investment assets, the distribution of legacy wealth is less able to recover across the distribution of outcomes. By age 100, the investment portfolio is also about to be depleted at the 10th percentile, though annuity income is still available to the couple for as long as they live. Legacy is 8 percent less at the median, and 1 percent more at the 90th percentile. Scenario 4 has taken advantage of only one-type of actuarial bond, creating potential trade-offs when compared with Scenario 3: more retirement income, but less legacy wealth.

Financial advisor making agreement with his client in cafe
getty
MORE FOR YOU
Nevertheless, when we evaluate the combined lifetime spending power, we do find that Scenario 4 is more efficient, with increases across the distribution of outcomes. In particular, at the median the 9 percent boost in lifetime annual spending more than offsets the 8 percent drop in legacy on a net basis.
Next, Scenario 5 integrates investments with whole life insurance and income annuities. The value of 401(k) assets at Jerry and Beth’s retirement age is less (17 percent less at the 10th percentile, 5 percent less at the median, but about the same at the 90th percentile) than in Scenario 3. Again, this results from less being invested in the 401(k) as more went to the higher whole life insurance premiums, and from the asset allocation in the 401(k) being more aggressive when treating cash value as a bond. The after-tax cash value is $210K at age sixty-five. When adding the cash value to the 401(k) assets, more is obtained at retirement. This results from the tax advantages of life insurance and from the lower internal insurance costs of whole life insurance as cash value reduces the amount of death benefit at risk for the insurance company.
We next consider how much income can be generated by these assets. With partial annuitization through a single life income annuity with a 4.47 percent payout for an amount equal to the death benefit of the whole life policy at age sixty-five, inflation-adjusted annuity income is $22,350 after taxes are paid. The 3.69 percent withdrawal strategy (driven by the more aggressive asset allocation that accounts for the cash value and annuity premium) is then applied to remaining investment assets, generating additional income. Total retirement income at age sixty-five ranges from $19,587 to $59,677, with a median of $34,759. Compared to Scenario 3, retirement income is 8 percent larger at the 10th percentile, 17 percent larger at the median, and 18 percent larger at the 90th percentile.
As for legacy wealth at age 100, Scenario 5 maintains the death benefit of $500K after taxes, which is still available despite investments depleting at the 10th percentile. At the median, Scenario 5 supports legacy wealth of $1.49 million, which is 46 percent larger than in Scenario 3. Of this, $500K is the death benefit and the other $949K is the remaining portfolio balance after taxes. At the 90th percentile, legacy wealth is 33 percent larger than in Scenario 3. Even after accounting for the higher supported spending, legacy wealth is still larger in Scenario 5 in 94 percent of the simulations. Discounted lifetime spending is greater across the distribution of outcomes, reflecting the greater spending and legacy potential of this integrated strategy.
Exhibit 7.7 provides a visualization of these three strategies in terms of median spending and legacy between ages sixty-five and 100. The investments and term life strategy of Scenario 3 supports the least spending, though it does offer the highest median legacy until age eighty-three. After that point, Scenario 5 with the whole life insurance and single life income annuity offers a higher legacy as well as the highest spending across the age range. Scenario 4 with the investments and joint life annuity offers spending that falls between the other two strategies, but legacy is the least as the high level of annuitization leaves too little in the investment portfolio to grow and catch up.
Exhibit 7.7 Whole Life Insurance Combined with Investments and Income Annuities: Median Spending and Legacy
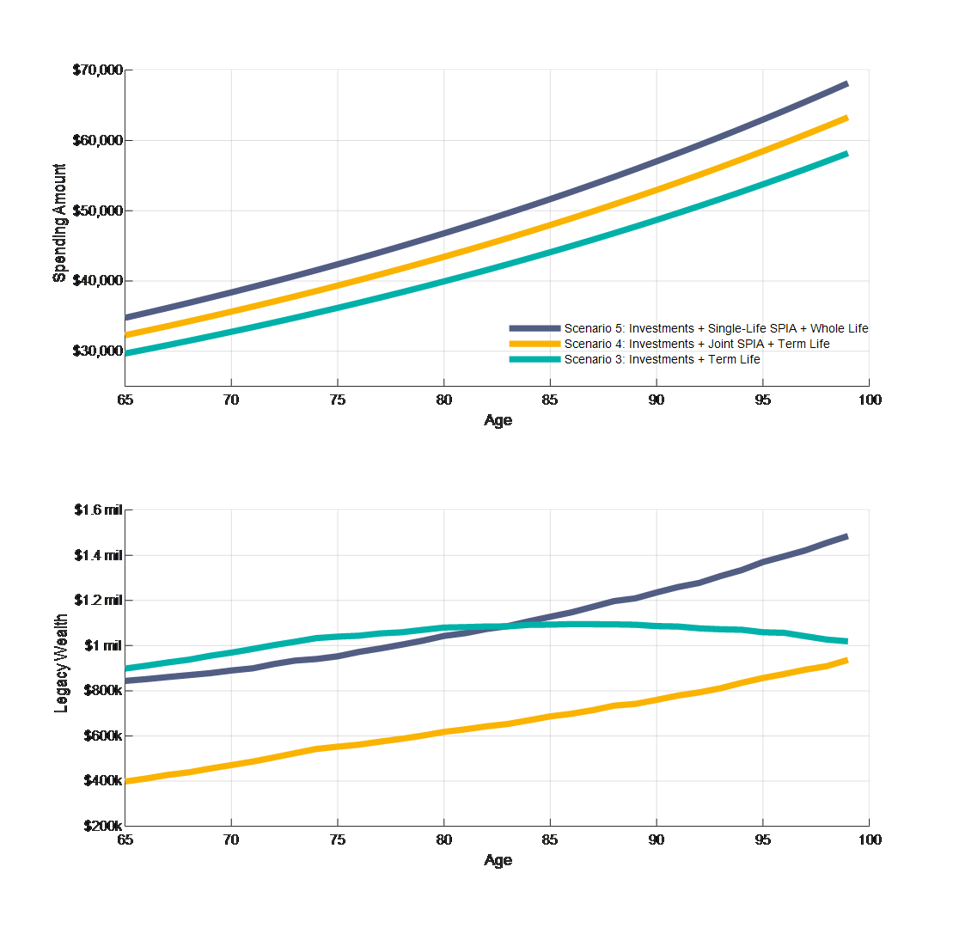
Exhibit 7.7 Whole Life Insurance Combined with Investments and Income Annuities: Median Spending and … [+]
Retirement Researcher
Generally, the integrated approach provides more legacy wealth while also supporting more retirement income. At the median, Scenario 5 provides 17 percent more lifetime spending and 46 percent more legacy than Scenario 3, with 25 percent growth in overall lifetime spending power. This is the meaning of greater efficiency. The upside growth potential of investments is insufficient to beat a more integrated approach using actuarial science and mortality credits alongside investments.
*This is an excerpt from Wade Pfau’s book, Safety-First Retirement Planning: An Integrated Approach for a Worry-Free Retirement. (The Retirement Researcher’s Guide Series), available now on Amazon
AMZN