
This article is part of a series. Click here to read the previous articles.
Another way to use life insurance as part of a lifetime plan is to view the death benefit as the psychological support needed to purchase a life-only income annuity as part of an integrated plan combining investments, whole life insurance, and income annuities. I create three additional scenarios for this investigation:
- Scenario 3 uses the same “buy term and invest the difference” strategy as Scenario 1, but now there is no specific legacy goal to be funded. The couple may spend more aggressively from their investment assets in retirement than in Scenario 1.
- Scenario 4 also uses term life insurance prior to retiring, but the couple will also purchase a joint life income annuity at the retirement date to help support retirement spending.
- Scenario 5 integrates investments with a whole life insurance policy and with a single life income annuity purchased at retirement.
Upon reaching age sixty-five in twenty-five years, Jerry and Beth will consider whether a single-premium immediate annuity (SPIA) might be a worthwhile addition to their retirement income plan. As discussed in Chapter 4, income annuities offer a variety of options regarding whether income starts immediately or is deferred, whether income covers a single life or joint lives, whether there is a certain payment for a set number of years, whether any cost-of-living adjustments will be made to benefits, and whether cash or installment refund provisions are included in the event of an early death.
Couple of senior people talking with financial advisor about life insurance
getty
To simplify our analysis, I consider two basic possibilities: Jerry buys a single life-only immediate annuity at sixty-five on his life, or Jerry and Beth buy a joint life and 100 percent survivor annuity. Both income annuities include a 2 percent annual cost-of-living adjustment that matches the assumed inflation rate, so that the annuity income adjusts to keep the purchasing power consistent throughout retirement. In both cases the annuities are purchased with qualified retirement funds after Jerry has stopped working and completes a rollover from his 401(k) to a traditional IRA.
MORE FOR YOU
A male life-only income annuity offers the highest payout rate (the most income) because the buyer offers the most mortality credits to the risk pool by accepting the higher short-term mortality risk. As mentioned in the case study overview, income annuities are priced using Society of Actuaries mortality data and the assumed 3 percent interest rate. With these interest rate and mortality assumptions and with the 2 percent cost-of-living adjustments on the annuity payments, I price a male life-only annuity for a forty-year-old when purchased at age sixty-five at 4.47 percent. The corresponding joint life annuity rate for the couple is 3.75 percent. The single life income annuity provides 19 percent more spending power for a given premium relative to the joint life income annuity.
With the accumulated investment assets, all retirement income in Scenario 3 will be generated with a systematic withdrawal strategy. Jerry seeks annual spending adjustments that match the overall 2 percent inflation rate. The couple uses the highest withdrawal rate possible that keeps investments above $0 by age 100 with a 90 percent probability. This means accepting a 90 percent chance that the spending level can be maintained at the initial amount in inflation-adjusted terms. In Scenario 3, spending from these assets falls to $0 once the portfolio balance depletes.
Scenario 4 shares many similarities with Scenario 3. Jerry uses the same term policy and invests the remainder in a tax-deferred account, leading to the same retirement date wealth accumulation. The difference happens at the retirement date. In Scenario 4, Jerry and Beth purchase a joint life and 100 percent survivorship income annuity with a premium amount equal to up to the pretax equivalent of the death benefit for the whole life policy at age sixty-five. With a 25 percent combined marginal tax rate, the pretax amount to be annuitized is up to $666,667. In simulations where the couple’s 401(k) balance has not grown sufficiently to leave at least $100,000 remaining after the annuity is purchased (to provide the couple with a pool of liquid assets to support contingency expenses), then the couple only annuitizes the amount that leaves $100,000 of liquid investable assets (on a pretax basis) after the annuity is purchased.
Though Jerry does not use the whole life policy in this scenario, annuitizing this pretax equivalent amount allows for a proper comparison between Scenarios 4 and 5. After annuitization, the remaining portfolio balance will be utilized for retirement spending using a systematic withdrawal strategy that maintains a 90 percent probability that the account remains above $0 by age 100. The joint life and 100 percent survivor income annuity provides income growing at 2 percent annually for as long as one member of the couple is alive, and any systematic withdrawals will supplement this income for as long as financial assets remain. Portfolio depletion is less drastic in this case, as at least the inflation-adjusted annuity income continues for life.
Next, in Scenario 5 Jerry uses a whole life insurance policy rather than term life insurance. Because of the higher premium, he invests less (starting at $9,836 instead of $15,957) in his 401(k) plan. Second, Jerry buys a male life-only income annuity at sixty-five with the same amount of assets from his retirement portfolio as in Scenario 4. He can now opt for single life instead of joint life because the death benefit from his whole life insurance policy will replace the annuity income stream upon his death.
If desired, Beth could then use part of the death benefit to buy another single life income annuity. As payout rates increase with age, the death benefit should be sufficient to support at least as much annuity income after a few years have passed to account for the lower payout rates for longer-living females. The difference in annuity payout rates (4.47 percent instead of 3.75 percent) allows for 19 percent more income to be generated by the same annuity premium as compared to Scenario 4. Any remaining investment assets will be utilized with a spending rate that supports a 90 percent chance that assets remain by age 100.
Like Scenario 2 in the previous case study, Scenario 5 also treats the cash value as part of the fixed-income allocation and adjusts the stock allocation in the remaining investment portfolio to keep the overall targeted ratio between stocks and bonds at each age. As well, the annuity purchase in Scenarios 4 and 5 is also counted as part of the bond allocation to increase the stock allocation for remaining investment assets. This is important because otherwise, a strategy which combines an investment portfolio with the same asset allocation as before, with a conservatively invested whole life insurance policy and income annuity, would create a more conservative overall asset allocation from the retirement balance sheet perspective. This would reduce growth potential within the strategy.
With these adjustments, I am essentially asking whether the fixed-income component for household assets should be allocated only to traditional bonds or also to actuarial bonds like whole life insurance and income annuities.
Exhibit 7.6 outlines the retirement outcomes for Jerry and Beth. The first part of the exhibit summarizes how they allocate their savings between insurance and Jerry’s 401(k) for the three scenarios, as described earlier.
Scenario 3 presents the strategy for buying term insurance and investing the difference in a target date fund. In after-tax terms at retirement, the wealth accumulation ranges from $541K at the 10th percentile to $1.5 million at the 90th percentile, with a median outcome of $883K. With the capital market expectations and asset allocation decisions, the sustainable spending rate that supports a 90 percent chance that assets remain at age 100 is 3.36 percent. This spending rate supports after-tax inflation-adjusted retirement income ranging from $18,180 at the 10th percentile to $50,548 at the 90th percentile, with a median of $29,676.
As for legacy wealth at age 100, it ranges from $3,294 (effectively $0) at the 10th percentile to $3.36 million at the 90th percentile, with a median amount of $1.02 million. Legacy wealth consists of the after-tax value of any remaining financial assets in the investment portfolio and any life insurance death benefit. With Scenario 3, there is no annuitization or death benefit. Investment assets are the only resource to support spending and legacy in retirement.
Exhibit 7.6 Whole Life Insurance Combined with Investments and Income Annuities
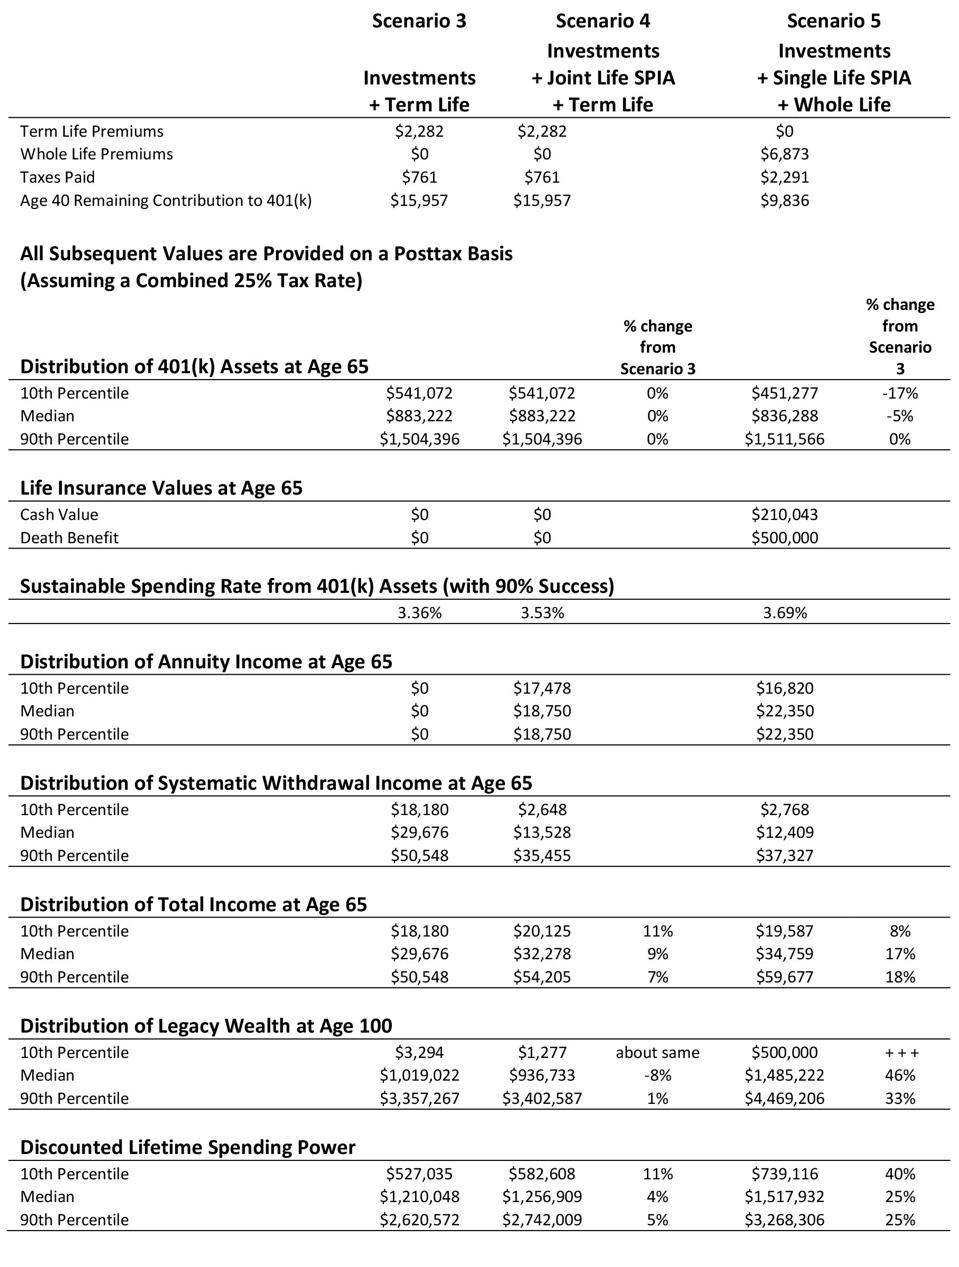
Exhibit 7.6 Whole Life Insurance Combined with Investments and Income Annuities
Retirement Researcher
Click here to read the next article in this series.
*This is an excerpt from Wade Pfau’s book, Safety-First Retirement Planning: An Integrated Approach for a Worry-Free Retirement. (The Retirement Researcher’s Guide Series), available now on Amazon