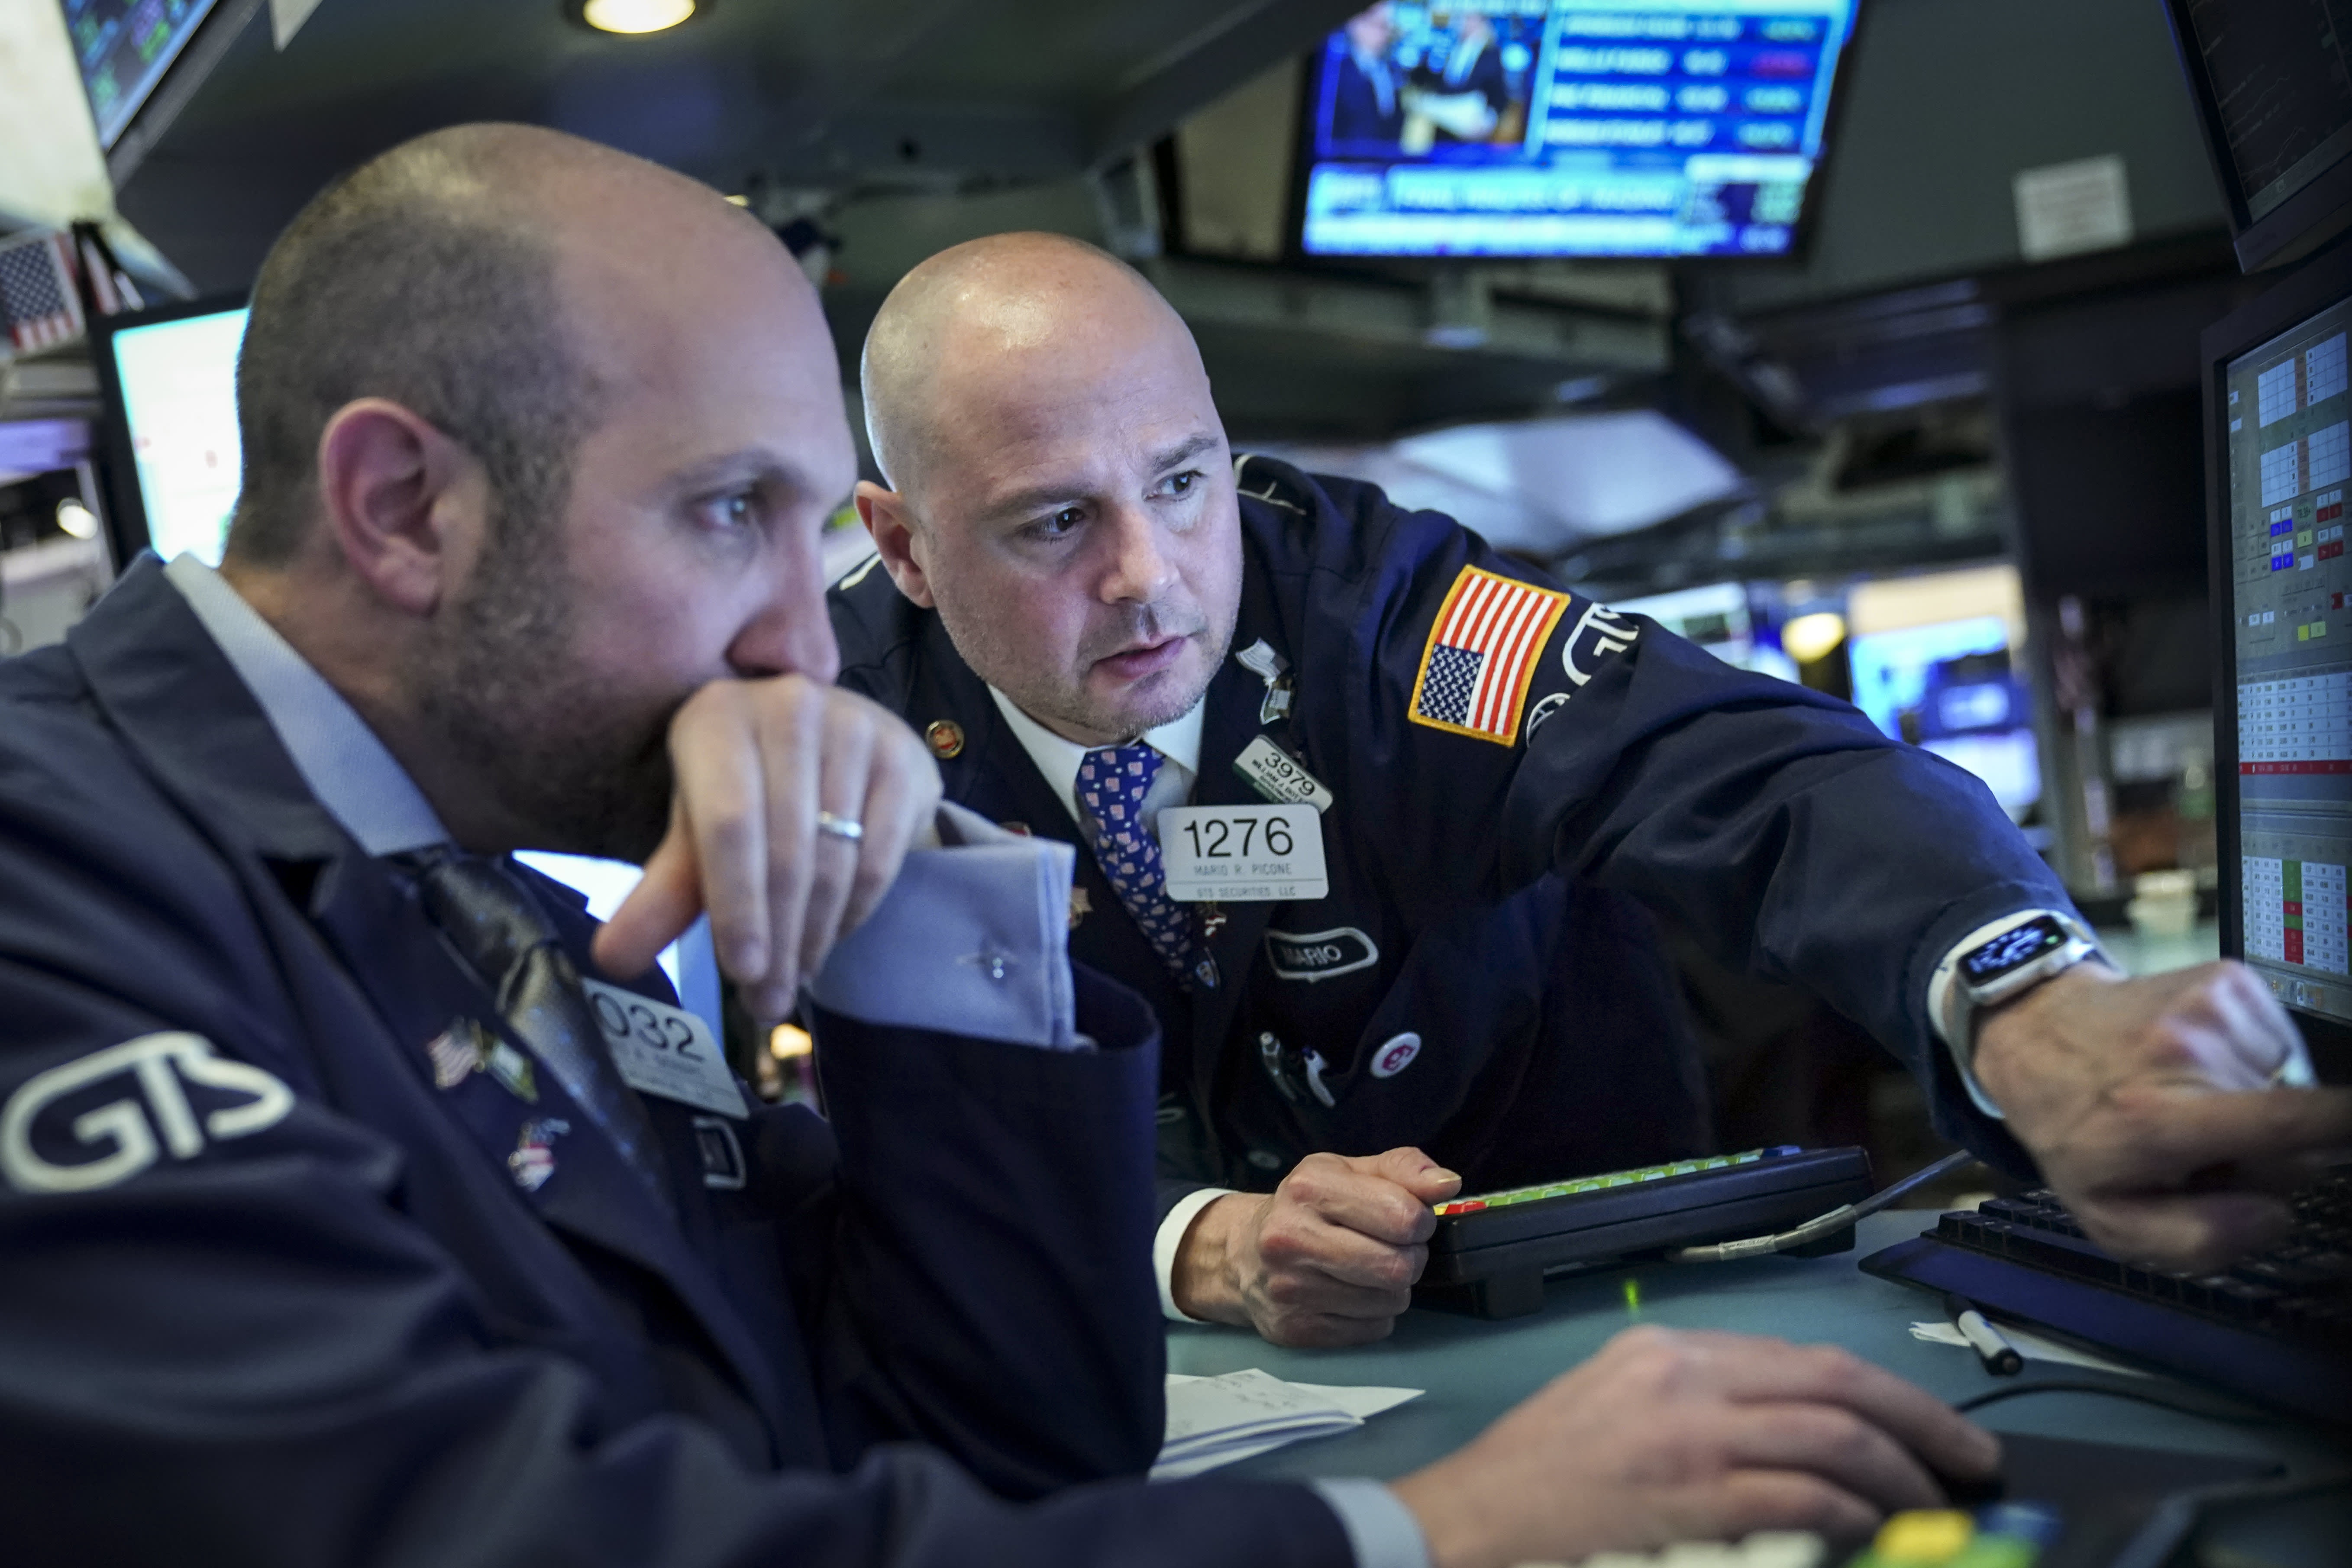
Traders and financial professionals work on the floor of the New York Stock Exchange.
Drew Angerer | Getty Images
Whether or not the U.S. is going into a recession is on the minds of Americans everywhere.
Google searches show recession fears have spiked exponentially since the end of July, when the Federal Reserve cut interest rates for the first time since the financial crisis.
Data is coming at investors from every angle with so-called recession indicators flashing signs of an economic slowdown brought on by slower growth abroad and the U.S.-China trade war. A slowing global economy is pressuring central banks abroad to lower borrowing rates at unprecedented levels and a tit-for-tat tariff war between Washington and Beijing is weighing on business sentiment.
Assessing these indicators is not easy, and many economists, money managers and analysts disagree about how healthy or unhealthy the U.S. economy really is and whether its long expansion can continue.
Here are some major recession indicators that are flashing red.
Bond market
Perhaps the most talked about recession indicator is the inverted yield curve.
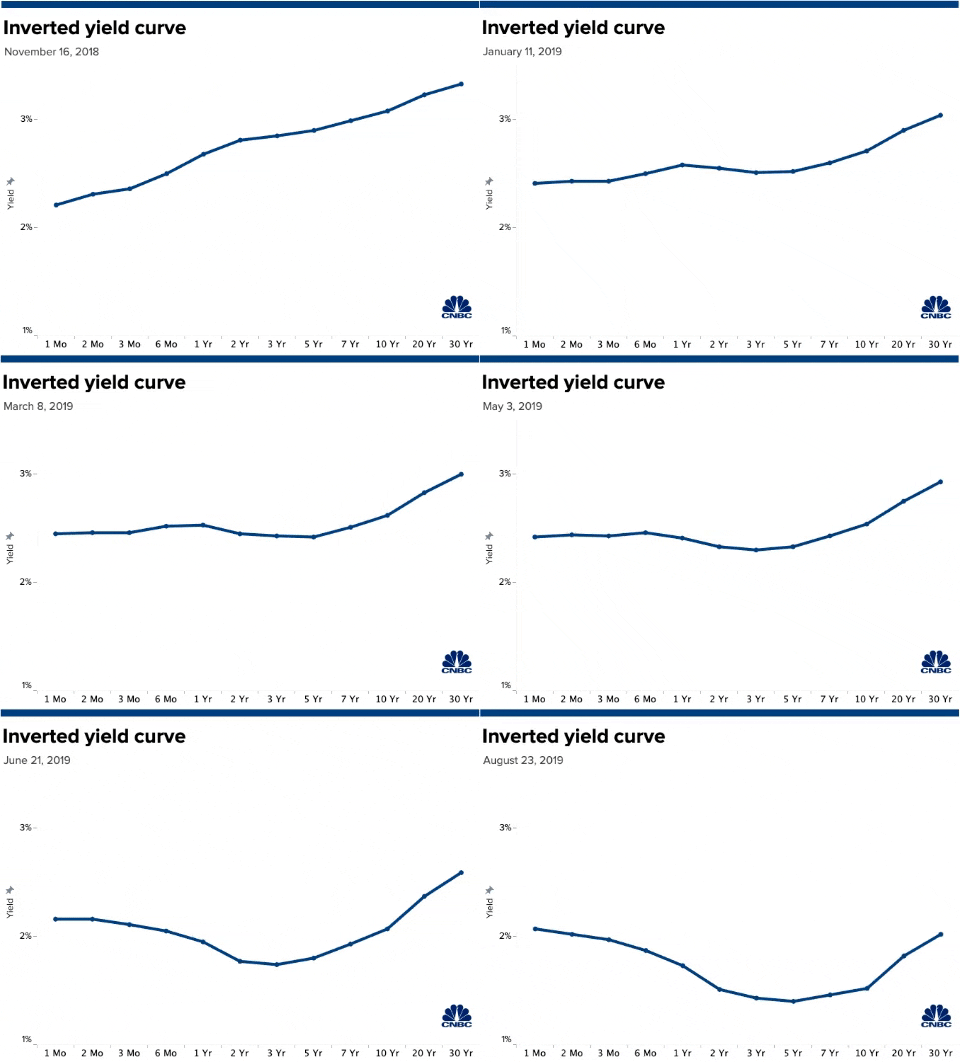
Amid falling interest rates in the broader U.S. bond market, the yield on the benchmark 10-year Treasury note has fallen below the 2-year yield several times since Aug. 14. In a healthy market, long-term bonds carry a higher interest rate than short-term bonds. When short-term bonds deliver a higher yield, it’s a called an inversion of the yield curve. The bond market phenomenon is historically a trusty signal of an eventual recession: It has preceded the seven last recessions. A recession occurs about 22 months after an inversion on average, according to Credit Suisse.
GDP
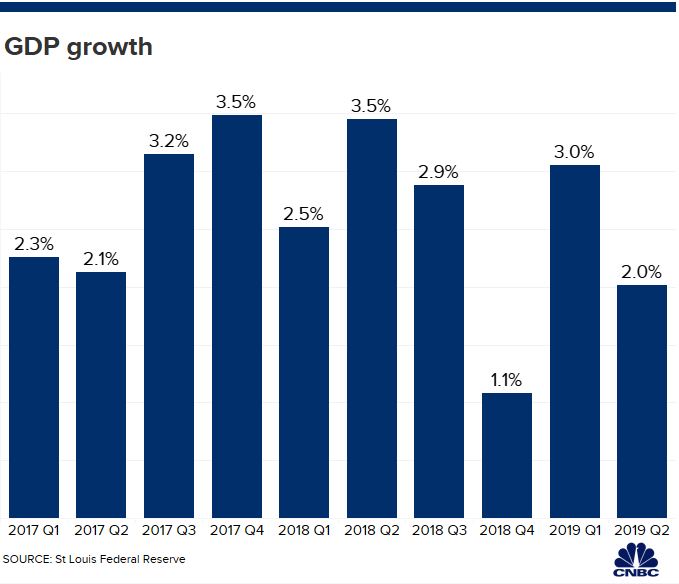
Gross domestic product in the U.S. is slowing. The economy expanded by 2% in the second quarter, the Commerce Department said in its second reading of GDP on Thursday.
Two percent is the lowest growth rate since the fourth quarter of 2018 and down from 3% growth in the first three months of this year.
Corporate profits
Manufacturing contraction
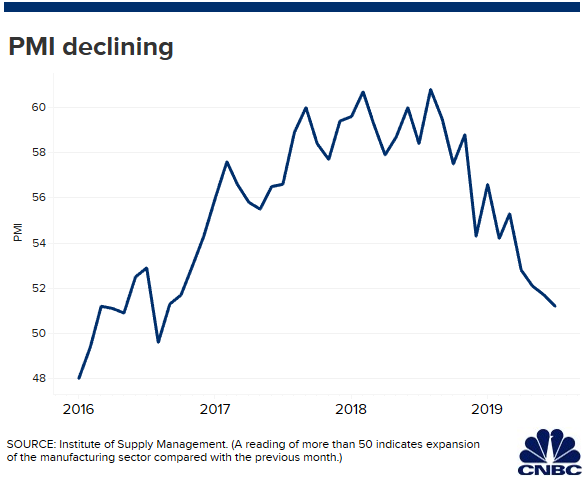
U.S. manufacturer growth slowed to the lowest level in almost 10 years in August. The U.S. manufacturing PMI (purchasing managers’ index) was 49.9 in August, down from 50.4 in July.
The reading is below the neutral 50.0 threshold for the first time since September 2009, according to IHS Markit. Any reading below 50 signals a contraction.
In July, Federal Reserve members expressed concerns about weak sectors of the economy like manufacturing. They said the U.S.-China trade war, coinciding with global growth worries, continues “to weigh on business confidence and firms’ capital expenditure plans,” according to minutes from the Fed’s July meeting.
The Cass Freight Index
The economic outlook from Freight’s perspective is looking grim.
The Cass Shipments Index fell 5.9% in July, following a 5.3% decline in June and a 6% drop in May.
“We repeat our message from last two months: the shipments index has gone from ‘warning of a potential slowdown’ to ‘signaling an economic contraction,'” the July report said. “Although the initial Q2 ’19 GDP was positive, it was not as positive upon dissection, and we see a growing risk that GDP will go negative by year’s end.”
Copper

Copper, informally known as Dr. Copper for its Ph.D. in economics, is known as a barometer of economic health because of its use in homebuilding and commercial construction.
The commodity is down over 13% in the last half year.
The breakdown in copper in August was “by far the most important development” and “markets were clearly too optimistic given the multiple risks in the macro backdrop,” said the Seven Report’s Tom Essaye.
Gold
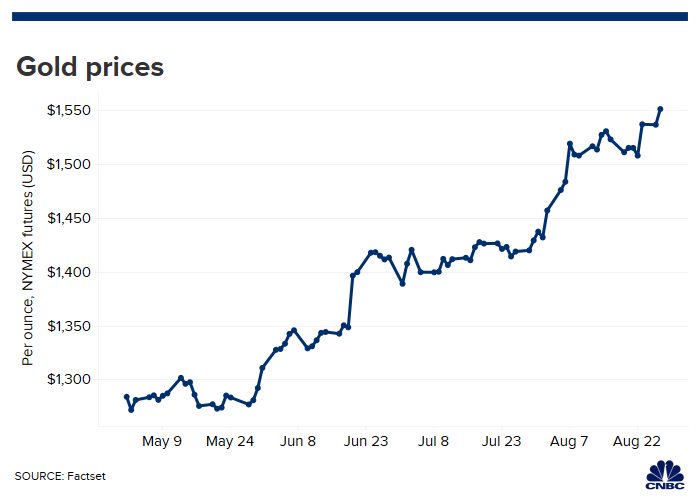
Gold prices have soared more than 20% since May when the U.S. and China escalated their tariff fight. Similar to government bonds, gold is known as a safe haven trade in times of economic uncertainty.
Global Economic Policy Uncertainty Index
The Economic Policy Uncertainty Index, an index designed to measure policy-related worries around the world, hit its all-time highest level, 342, in June.
The EPU Index tracks the amount of times newspaper articles use buzzwords related to economic and political uncertainty. Additionally, it measures the number of tax laws set to expire and the spectrum of disagreement among economists: The more dissent, the higher the index goes.
The index simmered in July to a level of 280 on hopes the a trade deal between the U.S. and China will be resolved.
Business spending
In the second quarter, gross private domestic investment tumbled 5.5%, the worst since the fourth quarter of 2015, according to the Commerce Department’s quarterly GDP report.
Coming off of a sugar high from President Donald Trump’s 2017 tax overhaul, businesses are hesitant to invest in future initiatives due to uncertainty.
