
Getty
Once again, the CDC has released figures on the fertility rate in the United States. Once again, the figures show an all-time low. In May, the CDC released its provisional 2018 rates, with a total fertility rate of 1.728 births per woman. On Wednesday, the CDC released its final rate, at 1.730, a decline from 1.766 in 2017 and 1.821 in 2016. That puts it at an all-time low, slightly below its 1976 trough of 1.738.
Explanations abound for the drop in fertility rates.
In the early post-recession years, the answer was simply, “it’s cyclical,” and that was reasonable enough. After its prior low in the 70s and early 80s, the rate recovered, then dipped with the recession of the early 90s before climbing again; this is plain to see visually (using World Bank and CDC data).
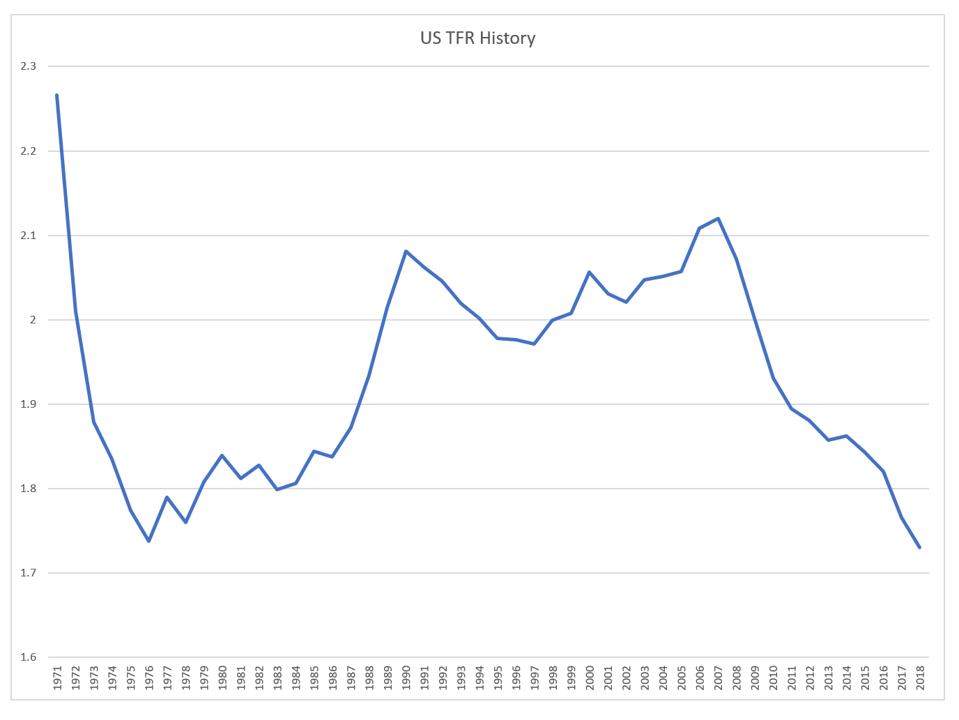
US fertility rates 1971 – 2018
Postponing children in a time of economic uncertainty makes sense, although a study at the Center for Retirement Research attributes the recent decline to a host of other long-term factors, including declines in religious affiliation, the increasing “opportunity cost” as the gap between men’s and women’s wages narrows, and the impact of changing immigration patterns.
At the same time, the demographer Lyman Stone offers an alternate explanation: it’s not about childbearing in isolation but about marriage. Despite the worries about nonmarital childbearing, it is due to the postponement of marriage that Americans are having fewer children. And this isn’t merely speculation – it’s based on the math of differing fertility rates by marital status and changing marriage patterns over time.
Honestly, this narrative isn’t quite convincing, when it’s told in terms of college-educated young adults postponing marriage and family. Yes, it is true that the Generation X middle-class was more likely to marry in their late 20s and have children in their early 30s, and the Millennial middle-class is more likely to marry in their early 30s and have children in their late 30s, but the drops in childbearing have been at significantly younger ages, and are not being “made up for” by meaningful increases later. Here’s a comparison table looking at 2007 (the peak year) vs. 2018, by age:
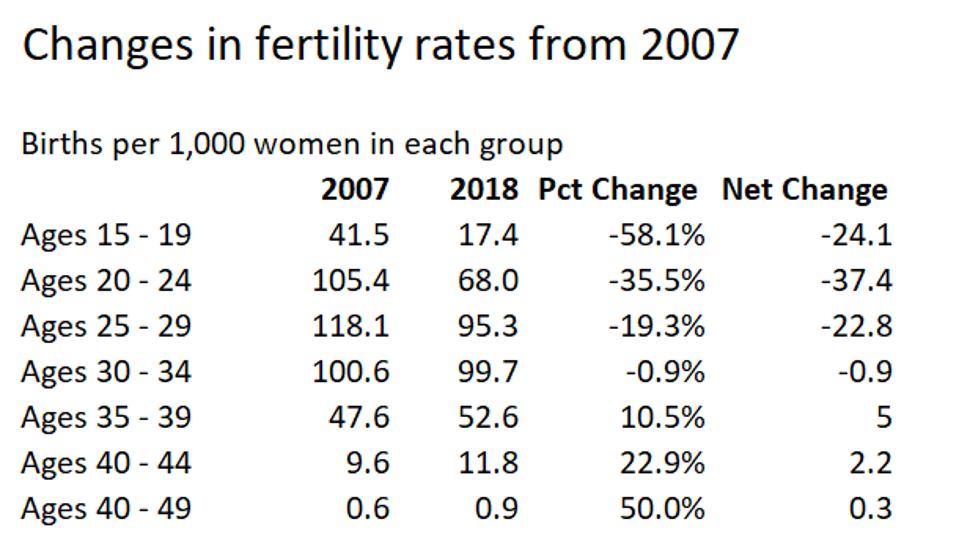
Fertility trends by age
But it doesn’t really make sense to construct a narrative of fertility decline based on changes in middle-class norms when it’s not the middle class having most of the babies. In a 2017 research brief, researchers W. Bradford Wilcox and Wendy Wang calculated total fertility rates by class:
- For the middle and upper class, 1.7 children per women.
- For the working class, 1.8.
- For the poor, 2.4.
Among teens, there has certainly been a heavy push towards the use of LARCs (long-acting reversible contraceptives, that is, implants and IUDs). But what of women in their 20s?
At the same time, in that same research brief, Wilcox and Wang document the dramatic class divide in marriage. According to the 2015 American Community Survey,
- 56% of middle/upper-class adults ages 18 – 55 were married, but only
- 39% of the same-aged working class, and
- 26% of the poor.
(”Poor” they define as income below the 20th percentile or high school drop outs, “working class” are those with income between the 20th and 50th percentile who do not have a bachelor’s degree, and “middle/upper class” are the rest.)
What’s more, this marriage divide is not longstanding, but comparatively new. Though they cannot split out older data in quite the same way, they are able to provide historical data by education status. Here’s their chart for those aged 25 – 55:
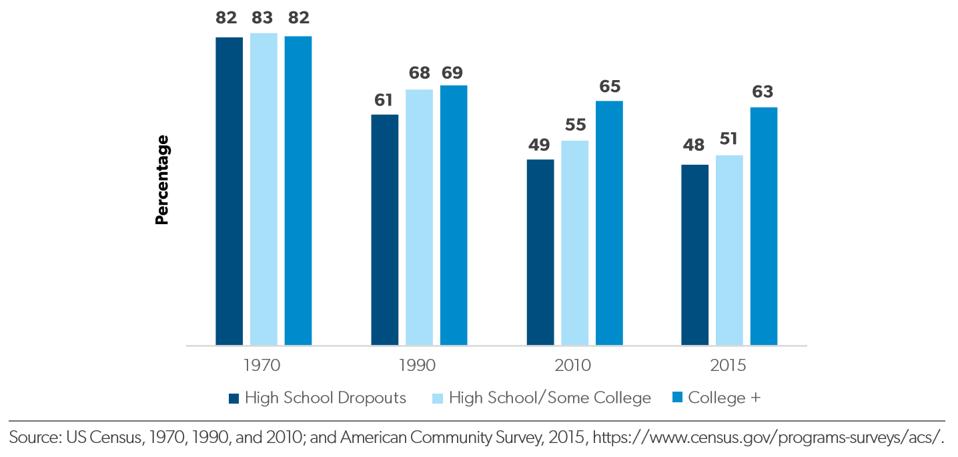
Marriage Rates by Education
So what does this mean? It certainly suggests that hand-wringing that student loan debt, to take one example, is causing depressed fertility, is misguided, but that this is an issue that has a lot more to do with the troubles that the working class face which have not been resolved despite the long-ago-ended recession.
All of which means that we still simply don’t know what the fertility rate will look like in the future, whether at some point we will finally reach some new stable level, or whether, like Finland (where the TFR dropped from 1.87 in 2010 to 1.35 in 2019), it will continue to collapse, and reach levels never envisioned in the U.S.
What do you think? You’re invited to comment at JaneTheActuary.com!