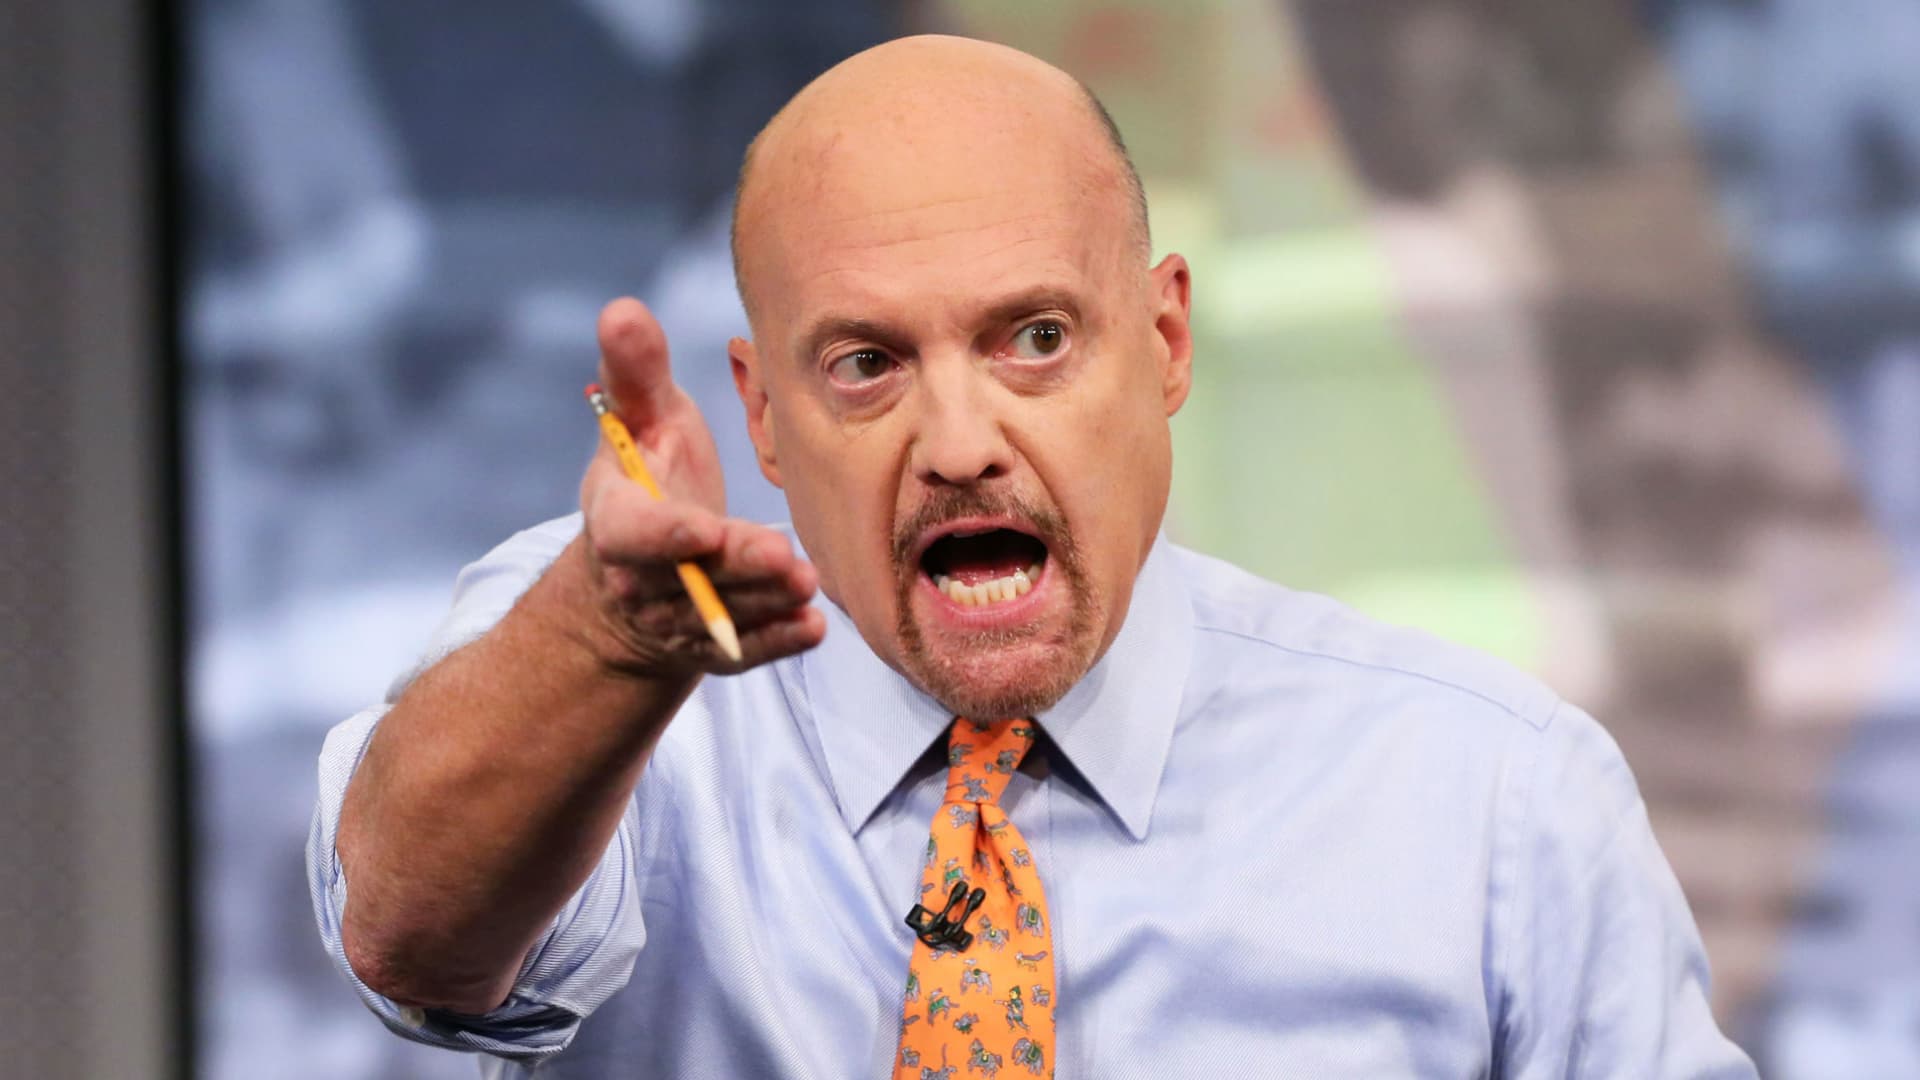
CNBC’s Jim Cramer on Wednesday said inflation could peak and the market could recover soon, leaning on chart analysis from legendary market technician Larry Williams.
“The charts and the history, as interpreted by Larry Williams, suggest one crazy thing, which is that inflation could soon peak, and then the second crazy thing, which is the stock market’s bottoming and due for a nice broad rally given from here to the end of June. Given his track record though, it wouldn’t surprise me if he’s right on both,” the “Mad Money” host said.
“Of course, his forecast also suggests we’ll get a pullback going into August, with stocks rebounding again as we approach the end of the summer,” he added. “This methodology can’t tell you the size of a potential move, but it’s surprisingly reliable when it comes to predicting the market’s overall direction.”
To explain William’s methodology, Cramer first explained that according to the technician, there are two ways of approaching inflation:
- Sticky consumer price index. This measures the cost of a basket of important items that change price slowly.
- Flexible consumer price index. This measures the cost of a basket of important items that change price rapidly.
In the chart below, the sticky price CPI is in orange while the flexible price CPI is in black.
Williams noticed that the flexible CPI is at a record high and in the zone where inflation usually peaks, Cramer said.
The below chart shows the three-month rate of change for the core flexible CPI in black with the 12-month rate of change in brown going back to 2016.
The flexible consumer price index is often a reliable leading indicator for the sticky consumer price index according to Williams, Cramer said – meaning that after flexible goods prices start climbing, stickier goods start catching up. This chart shows the flexible price CPI peaked last year.
“This tells Larry that we might already be turning the corner on inflation. It’s just not obvious to anyone on the surface yet,” Cramer said.
Also noteworthy is that inflation has historically stayed above 2.5% for about 29 months on average before dropping, according to Williams. Inflation has held above 2.5% for 14 months, meaning “we might already be halfway through,” Cramer said.
Williams also observed that the CPI has a dominant five-year cycle, which suggests that it should peak around the middle of this year and keep tumbling through 2025, Cramer said. Here is the chart showing the cycle:
The Advance Decline Line, a cumulative indicator measuring the number of stocks that are increasing daily compared to the number of stocks that are decreasing, is yet another tool Williams uses, Cramer said.
“Williams sees it as a terrific way to get a real sense of the stock market’s internal strength. … But he also likes to use the advance/decline line to make cyclical projections,” Cramer said.
“If you can get a sense of where the advance/decline line might be headed, then you’ll know when broad-based rallies or declines are most likely to occur. For Williams, this is a more stable way to take the temperature of the market than looking at a particular index,” he added.
Here is a chart of the advance/decline line going back to May 2021. Williams’ cyclical forecast is in red:
“As he sees it, the dominant short-term cycle in the advance/decline line has lasted for about 60 days, although there’s also a yearly cycle of about 240 days. The red line here combines both of those cycles to give us a forecast,” Cramer said.
He added that the forecast suggests to Williams that it’s time for the advance/decline line to go higher, which would mean a “major, broad-based rally in the stock market” that could carry into May, and possibly into the end of June.
Sign up now for the CNBC Investing Club to follow Jim Cramer’s every move in the market.
Questions for Cramer?
Call Cramer: 1-800-743-CNBC
Want to take a deep dive into Cramer’s world? Hit him up!
Mad Money Twitter – Jim Cramer Twitter – Facebook – Instagram
Questions, comments, suggestions for the “Mad Money” website? madcap@cnbc.com
